
Tenant Data Isolation: Patterns and Anti-Patterns
Explore effective patterns and pitfalls of tenant data isolation in multi-tenant systems to enhance security and compliance.
Jul 30, 2025
Read More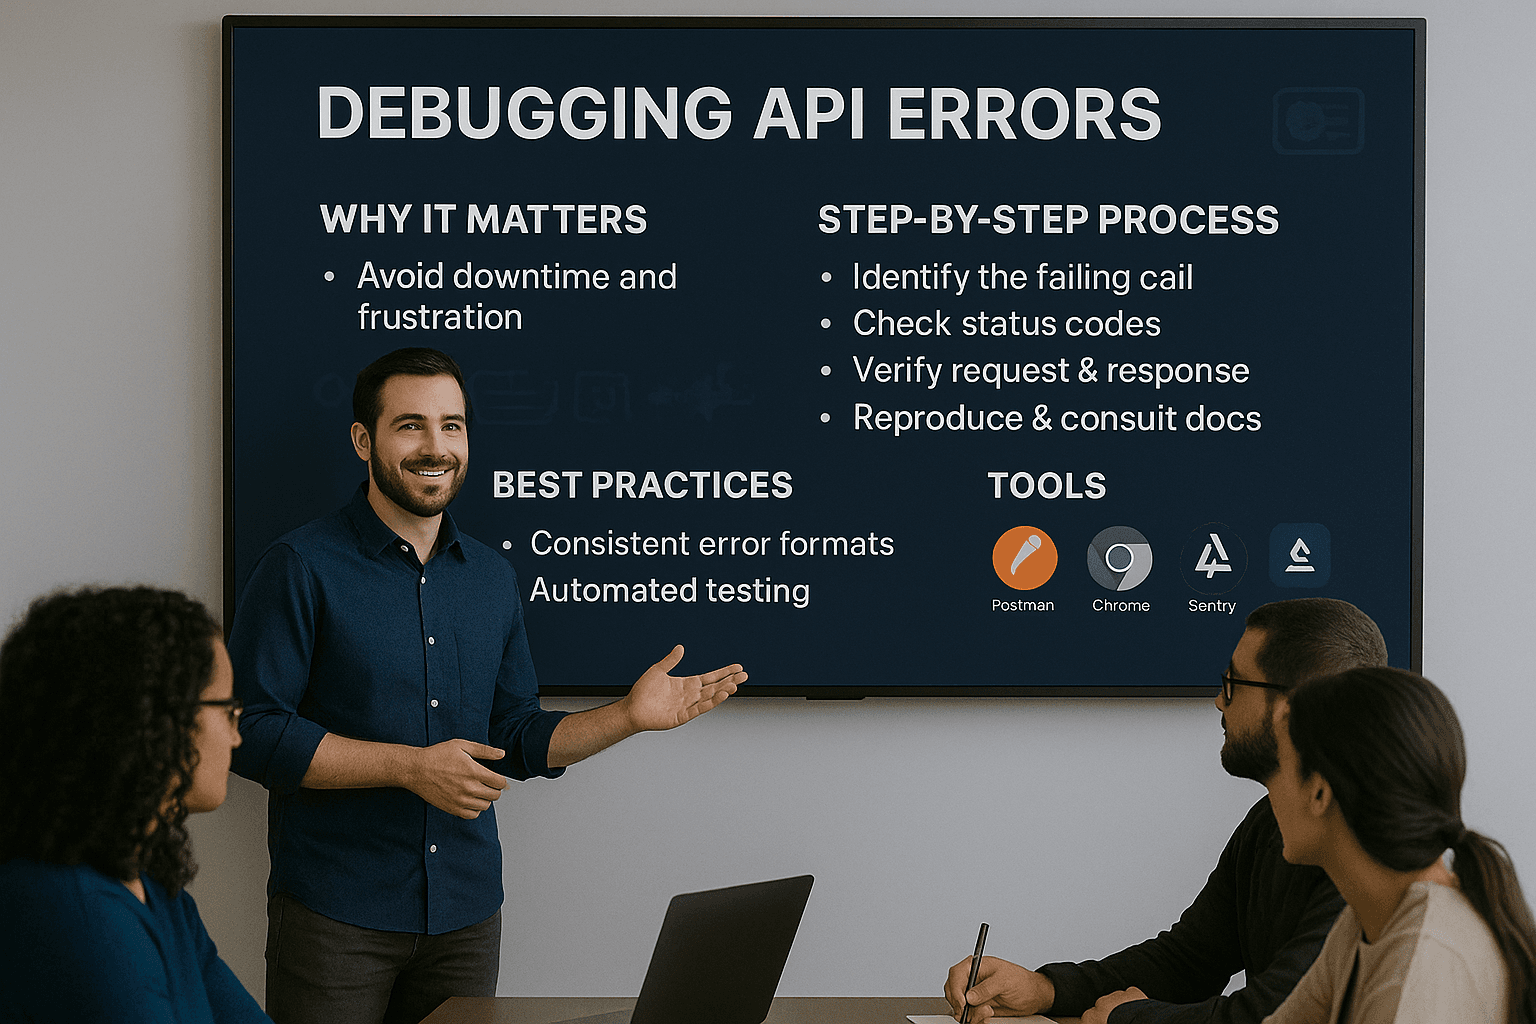
Debugging third-party API errors can save your app from crashing and keep users happy. Here's a quick breakdown of what you need to know:
Quick Tip: Always set up monitoring and fallback strategies to catch issues early and reduce downtime. Debugging APIs is complex, but a structured approach makes it manageable.
When working with third-party APIs, understanding the types of errors you might encounter is key to diagnosing and resolving issues quickly. Each error type has its own characteristics, and knowing how to address them can save you time and effort. Let’s take a closer look at some of the most common ones, starting with authentication problems - often the first hurdle developers face.
Authentication and authorization errors are some of the most frequent challenges when dealing with APIs. These errors typically show up as 401 Unauthorized or 403 Forbidden status codes.
| HTTP Status Code | Common Cause | Recommended Solution |
|---|---|---|
| 401 | Authentication Failure | Refresh tokens and verify credentials |
| 403 | Insufficient Permissions | Check user roles and token scopes |
APIs often enforce rate limits or quotas to manage resource usage. Exceeding these limits triggers 429 Too Many Requests errors, which can disrupt your application’s functionality.
For instance, GitHub’s API allows up to 5,000 requests per hour per user token or OAuth-authorized app. Similarly, Geoapify offers tiered rate limits based on pricing plans, such as 5 requests per second for the Free plan and 30 requests per second for the API250 plan.
"API rate limiting is a crucial security and performance technique that you can use to control how many times an API can be called within a specific timeframe." - Budhaditya Bhattacharya
Data format and schema mismatches are another common source of API errors. These occur when your application sends or expects data in a format that doesn’t match the API’s requirements. Common issues include:
Even small changes in data formatting, such as missing headers or altered response structures, can cause significant problems.
Network-related issues can cause connection timeouts or make servers temporarily unavailable. These problems often stem from:
Some APIs fall short when it comes to providing clear error messages. Instead of actionable details, you might get vague responses like "Bad Request" or "Internal Server Error."
These vague or inconsistent error messages force developers to implement multiple error-handling strategies, complicating the debugging process.
Each of these error types can overlap, creating a web of challenges. A systematic approach to debugging is essential to untangle these issues and keep your application running smoothly.
When third-party API errors occur, tackling them with a methodical approach can save you a lot of time and frustration. Here's a step-by-step guide to help you debug API errors effectively.
The first step is pinpointing which API call is causing the issue. Use your browser's developer tools - like Chrome DevTools - and navigate to the Network tab to monitor outgoing requests in real time. Look for requests marked with red status indicators or error codes. Adding logs in the browser’s console can also help you capture specific error responses or network failure details.
For backend debugging, dive into your server logs to identify failed requests. Logging both successful and failed calls can help you figure out whether the problem is tied to network issues, API responses, or how the data is handled. For example:
// Make API call to third-party system
var response = thirdPartyApiCall();
// Check if the API call was successful
if (response && response.getStatusCode() === 200) {
var responseBody = response.getBody(); // Inspect the response body for details
gs.info("API call successful. Response: " + responseBody);
// Proceed with further actions
} else {
gs.error("API call failed. Status code: " + response.getStatusCode());
// Handle the error scenario or log additional details
}
Double-check the API endpoints and request URLs for typos, missing parameters, or mismatched protocols (like HTTP vs. HTTPS). Once you’ve identified the failing call, use the error status codes to dig deeper.
HTTP status codes are a goldmine of information when it comes to diagnosing API failures. Errors generally fall into two categories: client-side (4xx) and server-side (5xx).
400 Bad Request, 401 Unauthorized, and 403 Forbidden, which usually point to problems with the request itself.500 Internal Server Error or 503 Service Unavailable indicate problems on the API provider’s end.Categorizing errors by their status codes can help you determine whether the issue lies with your request or the API server. For instance, a 503 Service Unavailable response with a Retry-After header suggests a temporary server overload and provides guidance on when to retry.
Once you’ve identified the failing call and decoded the status code, it’s time to inspect the data being sent and received. Verify that your request payload and headers align with the API's requirements.
This step ensures that your request is formatted correctly and nothing critical is being overlooked.
Reproducing the error in a controlled environment can help you zero in on the root cause. Mock APIs are particularly useful here - they let you simulate the exact error conditions without affecting live data or running into rate limits. By isolating the issue from other business logic, you can focus solely on the problem at hand.
API documentation is one of your best allies when debugging. Most providers include detailed explanations for their error codes, along with guidelines for resolving common issues like rate limiting, authentication, and data validation.
Be sure to check for updates to the API, such as changes to data schemas or authentication methods, which could explain the failure. Problems might also arise from using incorrect or expired API keys.
After resolving the immediate issue, put systems in place to catch similar problems in the future. Logging and monitoring allow you to stay on top of API health and performance.
For better traceability, implement correlation IDs to follow requests through your system. You might also want to add health check endpoints, circuit breaker patterns, and retry mechanisms with exponential backoff to handle temporary network hiccups gracefully.
Once you're comfortable with the step-by-step debugging process, adopting consistent practices across your development workflow can save you hours of work by preventing recurring problems. These practices work hand-in-hand with the structured steps mentioned earlier, ensuring a smoother API integration experience.
To avoid repeated issues, establish a uniform error-handling system. This approach not only reduces debugging time but also improves the overall experience for developers.
Start by setting up a hierarchical error code system that organizes errors into categories like authentication failures, validation errors, or server-side issues. This makes it easier to pinpoint the problem. Ensure your error responses follow a consistent format across all integrations, enabling your team to identify and resolve issues faster.
For instance, Stripe's API uses standard HTTP status codes and categorizes errors clearly, such as card_error or validation_error. Each error includes actionable details, a unique error ID, and documentation links for troubleshooting:
{
"error": {
"code": "resource_missing",
"doc_url": "https://stripe.com/docs/error-codes/resource-missing",
"message": "No such customer: cus_12345",
"param": "customer",
"type": "invalid_request_error"
}
}
Similarly, GitHub's API provides clear error messages with documentation links, making it easy to address issues:
{
"message": "Validation Failed",
"errors": [
{
"resource": "Issue",
"field": "title",
"code": "missing_field"
}
],
"documentation_url": "https://docs.github.com/rest/reference/issues#create-an-issue"
}
Incorporate unique request IDs to trace specific problems effectively. Additionally, use Retry-After headers in rate-limiting scenarios or during temporary server issues to guide retry logic.
While manual debugging is essential, automated testing ensures long-term API reliability. It acts as a safety net, catching errors before they affect production and providing quick feedback during development.
Focus on automating tests for critical functions like user authentication, payment systems, and other core business operations - areas where API failures can have the most impact. Keep your test scripts modular and straightforward to make them easier to maintain as your API evolves.
Parallel testing can significantly reduce testing time, offering faster feedback without compromising quality. Integrate these tests into your CI/CD pipeline so that every code update triggers automatic testing, ensuring issues are caught early.
Your automated tests should include detailed error handling, meaningful assertions, and comprehensive logging to make diagnosing problems easier. Use mocking and virtualization to simulate API responses, allowing you to test edge cases and failure scenarios without relying on live services.
Encouraging a culture of knowledge sharing around API debugging can greatly enhance your team's efficiency and reduce time spent on recurring issues.
Create a centralized knowledge base that includes API specifications, common error patterns, debugging techniques, and solutions to past problems. This prevents your team from solving the same issues repeatedly.
Regular peer code reviews not only improve code quality but also provide opportunities to share debugging strategies and catch potential issues early. Host workshops or seminars on API integration topics, especially when adopting new third-party services or tackling complex debugging challenges.
Document your debugging processes, tools, and lessons learned. Teams with well-organized documentation report completing projects up to 28% faster, as they can quickly reference past solutions.
Consider implementing peer-recognition programs to encourage contributions to the knowledge base. Such initiatives have been shown to increase participation in team learning efforts.
The right tools can turn hours of API debugging into just minutes. From simple browser-based options to advanced enterprise platforms, the debugging landscape is packed with solutions tailored for different needs.
Here’s a look at some popular debugging tools to help you decide which one suits your integration requirements:
| Tool | Best For | Key Strengths | Limitations | Pricing |
|---|---|---|---|---|
| Chrome DevTools | Quick browser-based debugging | Free, real-time network analysis, built-in console logging | Limited to browser environments, lacks advanced automation | Free |
| Postman | API testing and development | User-friendly interface, environment variables, automated testing | Can become complex for larger teams | Free tier available |
| Apidog | All-in-one API development | Combines design, testing, debugging, and mock server features | Requires time to master the full feature set | From $9 per user/month |
| Fiddler | HTTP traffic monitoring | Request manipulation, HTTPS decryption | Primarily Windows-focused, steep learning curve | Starts at $6/month per user |
| Sentry | Real-time error monitoring | Tracks errors and provides performance insights | Focused on errors, not a full debugging solution | Varies by usage |
Apidog shines as an all-in-one platform that integrates API design, testing, and debugging, offering real-time testing and mock server capabilities. This makes it especially appealing for teams aiming to streamline their API workflows.
Chrome DevTools, on the other hand, remains the top choice for quick, browser-based debugging sessions. For more complex scenarios, like mobile or HTTPS traffic, Charles Proxy is an excellent tool for debugging API interactions.
API gateways provide a centralized solution for monitoring and debugging. Acting as a hub, they log, analyze, and monitor every request and response in real time. Designed for high-traffic applications, modern gateways can handle hundreds of thousands of concurrent API calls. They also allow you to set up alerts for performance issues, enabling you to monitor response times, error rates, and usage patterns across all third-party integrations from a single dashboard.
This unified management layer simplifies the complexities of monitoring and debugging in large-scale systems.
Centralized logging brings all your API activity into one place, making the debugging process much simpler. Instead of sifting through scattered logs across multiple systems, centralized logging consolidates everything into a unified view. This approach allows for real-time monitoring and automated alerts.
As Edo Williams, Lead Software Engineer at Intel, explains:
"DreamFactory streamlines everything and makes it easy to concentrate on building your front end application. I had found something that just click, click, click... connect, and you are good to go."
Centralized logging offers several advantages:
| Benefit | Description | Impact |
|---|---|---|
| Faster Troubleshooting | Consolidates all API activities | Speeds up issue identification and resolution |
| Enhanced Security | Provides audit trails and access tracking | Improves threat detection and compliance |
| Resource Optimization | Boosts storage and system performance | Reduces overhead and enhances efficiency |
| Better Analytics | Offers a complete view of API usage patterns | Helps identify areas for improvement |
To make the most of centralized logging, use JSON formatting for logs - it's flexible, structured, and easy to analyze programmatically. Consistent tagging and formatting across all API endpoints also ensure your logs remain searchable and informative.
Performance tracking complements centralized logging by transforming raw data into actionable insights. Tools like Datadog and the ELK Stack (Elasticsearch, Logstash, Kibana) excel in identifying API performance trends, error patterns, and traffic spikes. Set up automated alerts for critical issues or predefined patterns, so you can address problems before users notice them. This proactive approach allows for timely fixes and ensures smooth API operations.
Debugging third-party API errors becomes much simpler when approached systematically. The trick lies in breaking down the problem into smaller, manageable steps and leveraging the right tools to pinpoint and resolve issues effectively.
Start by identifying the specific API call causing the problem. Examine its status code, response data, and test with different inputs to narrow down the root cause. For instance, a payment gateway integration repeatedly failed because developers mistakenly used "Auth: Bearer <API_KEY>" instead of the required "Authorization: Bearer <API_KEY>" header format. Similarly, a warehouse system encountered issues with a shipping label API due to strict ZIP code formatting requirements that flagged invalid characters not immediately apparent.
Beyond resolving the issue, effective error handling should include displaying clear error messages, offering retry options, and automating tests to catch problems early. Once the issue is isolated, consistent error handling practices and proactive monitoring are key to maintaining smooth operations.
Fixing immediate issues is only part of the equation - monitoring and documentation play a long-term role in maintaining API performance. Businesses that integrate APIs see 12% higher market capitalization growth compared to those that don’t, with over 90% of executives deeming APIs critical to their operations. However, 94% of organizations have faced API security challenges, underscoring the need for robust monitoring.
The financial stakes are high. IT downtime costs an average of $5,600 per minute, making investments in monitoring tools essential to minimize these losses.
Clear and thorough documentation is equally important. It acts as a bridge between API providers and users, offering detailed information about functionality, inputs, outputs, and error handling. As engineer Adrian Machado puts it:
"Clear and consistent API error handling is crucial for improving developer experience and reducing debugging time".
To prevent authentication errors when working with third-party APIs, stick to secure methods like OAuth 2.0 or OpenID Connect. Always handle tokens cautiously - never include them in URLs. Instead, pass tokens through authorization headers to keep them secure. Make it a habit to check token validity regularly and rotate API keys periodically to stay ahead of potential security risks.
You should also use role-based access control (RBAC) to restrict permissions, ensuring that only authorized users or systems can access sensitive data. Encrypt any sensitive information and carefully follow the API provider’s guidelines for best practices. These steps will help reduce errors and strengthen your security measures.
To handle API rate limits effectively and keep your services running smoothly, try these strategies:
It's also important to communicate rate limits clearly to users. Tools like API gateways can give you better control and visibility over traffic. By staying proactive with these practices, you can ensure a smooth experience for everyone using your application.
Centralized logging and monitoring tools make debugging much easier by offering a single, unified view of system performance and error details. By gathering logs from multiple sources into one place, they allow teams to track and resolve issues across distributed systems without the hassle of piecing information together.
With access to real-time insights, teams can quickly pinpoint and fix API errors, cutting down on downtime and speeding up response times. These tools also excel at spotting unusual patterns or potential security risks early, helping ensure operations run smoothly and problems are addressed swiftly.
Need an expert team to provide digital solutions for your business?
Book A Free CallDive into a wealth of knowledge with our unique articles and resources. Stay informed about the latest trends and best practices in the tech industry.
View All articlesExplore effective patterns and pitfalls of tenant data isolation in multi-tenant systems to enhance security and compliance.
Jul 30, 2025
Read More
Implement these 10 Quality Assurance steps to enhance the reliability and performance of your SaaS application while minimizing bugs and user abandonment.
May 21, 2025
Read More
AI automation is revolutionizing SaaS performance by optimizing costs, enhancing user experiences, and streamlining operations.
May 15, 2025
Read More
Learn how to successfully launch your SaaS MVP in just 90 days by following these critical steps for validation, development, and iteration.
May 16, 2025
Read More
Learn how to safeguard your API backends against rising Man-in-the-Middle attacks through encryption, authentication, and secure network practices.
Jul 30, 2025
Read More
Choosing between a mobile app and a web app for your SaaS product? Explore key factors like cost, user engagement, and development speed.
May 21, 2025
Read More
Learn best practices for linting React code to improve quality, consistency, and collaboration in your development projects.
Jul 30, 2025
Read More
The IT industry continues to drive innovation and redefine the way businesses operate. In this blog, we explore how IT solutions are transforming industries, enhancing...
May 8, 2025
Read More
When it comes to SaaS (Software as a Service) platforms, one thing is clear: user experience (UX) is everything. At Propellius Technologies, we know that...
May 8, 2025
Read More
Apple faces unprecedented challenges in AI as OpenAI acquires Jony Ive's design team for $6.5B and Google partners with Samsung on Android XR. Can Apple's...
May 22, 2025
Read More
Explore common challenges in SaaS development, including scalability, security, and API integration, along with effective solutions for each.
May 23, 2025
Read More
Learn how to manage concurrency in serverless architectures effectively to enhance performance, reduce costs, and prevent throttling.
Jul 30, 2025
Read More
Trump administration revokes Harvard's ability to enroll international students, impacting 6,800 students and threatening Silicon Valley's talent pipeline. Analysis of implications for US tech leadership.
May 23, 2025
Read More
Explore the top cloud solutions that optimize scalability, security, and cost for modern SaaS architecture, helping businesses thrive in the cloud.
May 23, 2025
Read More
You know how the internet has become such a big part of our lives? Well, the way we use it has changed a lot over...
May 8, 2025
Read More
Learn how staff augmentation can help tech startups save costs, access global talent, and scale teams quickly for efficient growth.
May 26, 2025
Read More
In the digital age, eCommerce has become a cornerstone of the global retail landscape. The low barriers to entry and the promise of reaching a...
May 8, 2025
Read More
Learn how Atomic Design enhances React component organization by breaking down UIs into reusable, scalable pieces while navigating common challenges.
Jun 6, 2025
Read More
AI is revolutionizing how brands communicate. In this article, we dive into how Phrasee, a leader in AI-powered brand language generation, is enabling marketing teams...
Jun 6, 2025
Read More
Effective onboarding of augmented developers in Agile teams boosts productivity and retention through preparation, structured processes, and continuous feedback.
Jun 5, 2025
Read More
Selecting the right tech stack for your MVP is crucial for startup success, impacting costs, scalability, and development speed.
Jun 5, 2025
Read More
Learn key strategies for scaling your SaaS product from MVP to enterprise level, focusing on architecture, performance, security, and cloud optimization.
May 26, 2025
Read More
Explore seven human-centered design principles that can transform your MVP into a user-centric product that resonates and drives success.
Jun 9, 2025
Read More
Optimize memory usage in AI workflows to cut costs and enhance performance with effective strategies and tools for better resource management.
May 29, 2025
Read More
Explore the essential UI/UX best practices for SaaS applications in 2025, focusing on personalization, accessibility, and innovative input methods.
May 26, 2025
Read More
Learn how a 90-day MVP sprint can minimize risk, cut costs, and ensure a successful product launch through rapid validation and user feedback.
May 30, 2025
Read MoreOptimize real-time streaming with effective data compression techniques that reduce latency and enhance performance across various industries.
Jun 17, 2025
Read More
Explore the strengths and weaknesses of Supabase and Firebase for real-time collaboration tools, focusing on scalability, performance, and developer experience.
Jun 6, 2025
Read More
Explore the differences between two leading platforms for MVP scaling, focusing on their database structures, pricing, security, and performance.
Jun 5, 2025
Read More
Learn how Test-Driven Development (TDD) can enhance the reliability and maintainability of React applications through structured testing.
Jun 6, 2025
Read More
Learn how to effectively balance technical debt with innovation to ensure sustainable growth and maintain a competitive edge in your startup.
May 29, 2025
Read More
Learn how to foster a thriving knowledge-sharing culture in remote teams through psychological safety, technology, and effective communication.
Jun 6, 2025
Read More
A complete guide to choosing the right mobile app development company—covering expertise, transparency, UX focus, agile methods, and long-term partnerships to ensure your app succeeds...
Jun 12, 2025
Read More
Explore effective caching strategies for dependency management that enhance build performance and reduce costs in software development.
Jul 29, 2025
Read More
Unlock your system's performance potential by effectively analyzing logs to identify bottlenecks and optimize operations.
Jun 17, 2025
Read More
Explore essential practices for checkpointing in stream processing to ensure data integrity, fault tolerance, and efficient recovery from failures.
Jun 9, 2025
Read More
Learn how to effectively use a popular JavaScript library for mocking and stubbing in tests, enhancing reliability and speed in your development process.
Jun 9, 2025
Read More
Learn how to effectively automate regression testing in CI/CD pipelines to enhance software reliability and speed up development.
Jun 17, 2025
Read More
Learn essential best practices for managing secrets in CI/CD pipelines to protect sensitive data and enhance security against breaches.
Jun 6, 2025
Read More
Explore how Agile roles enhance MVP development by fostering collaboration, speeding up delivery, and ensuring products meet user needs.
Jun 11, 2025
Read More
Explore how manual testing enabled startups to launch high-quality MVPs in just 90 days, ensuring speed without sacrificing user experience.
Jun 6, 2025
Read More
AI-driven predictive scaling enhances resource management in DevOps by forecasting demand, reducing costs, and ensuring system reliability.
Jul 29, 2025
Read More
Learn how to effectively scan and fix vulnerabilities in React and Node.js projects to ensure secure applications and safeguard against risks.
Jun 17, 2025
Read More
Agile sprints streamline MVP development, enabling rapid iterations, user feedback integration, and efficient project management for startups.
Jun 17, 2025
Read More
Aligning designers and developers through shared standards and effective collaboration can drastically improve efficiency and product quality.
Jun 11, 2025
Read More
Align your teams for faster MVP sprints by creating a shared vision, setting collaborative KPIs, and leveraging effective workflows.
Jul 29, 2025
Read More
Explore essential best practices for regression testing in DevOps, ensuring software stability and quality amid rapid development cycles.
Jul 29, 2025
Read More
Learn how to create an effective shared knowledge base that enhances team collaboration, boosts productivity, and maintains security.
Jul 30, 2025
Read MoreLearn how to leverage Figma for effective design system collaboration, enhancing team workflows and ensuring consistent design practices.
Jul 30, 2025
Read More
Explore how a financial startup launched a minimum viable product in just 90 days through collaborative prototyping and user feedback.
Jul 29, 2025
Read More
Explore how automated load balancing enhances cloud app performance, reduces costs, and ensures reliability during traffic spikes.
Jul 30, 2025
Read MoreGet in Touch
Let's Make It Happen
Get Your Free Quote Today!

Get in Touch
Let's Make It Happen
Get Your Free Quote Today!

You bring the vision. We handle the build.